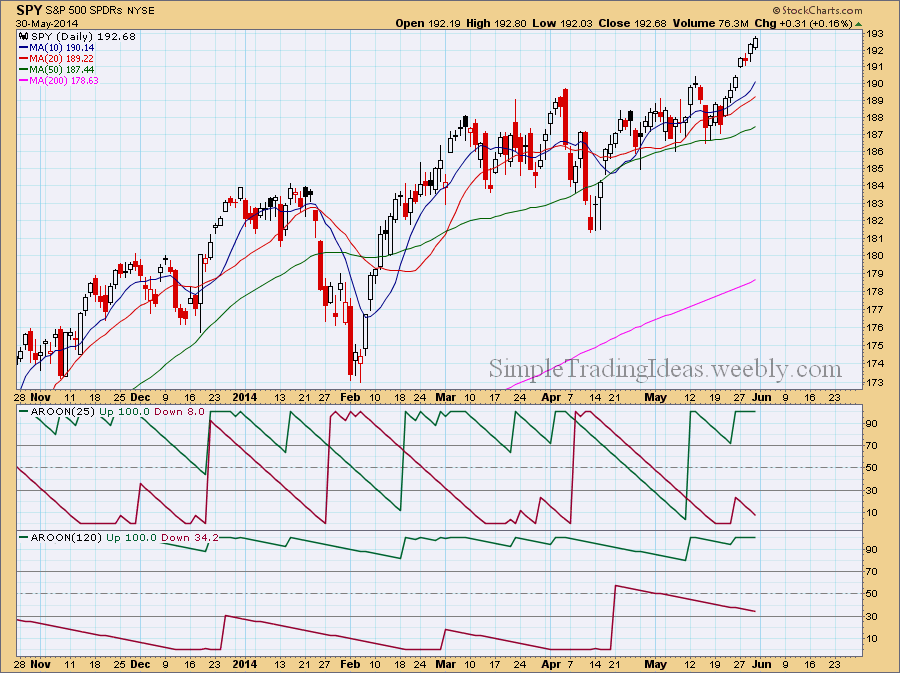
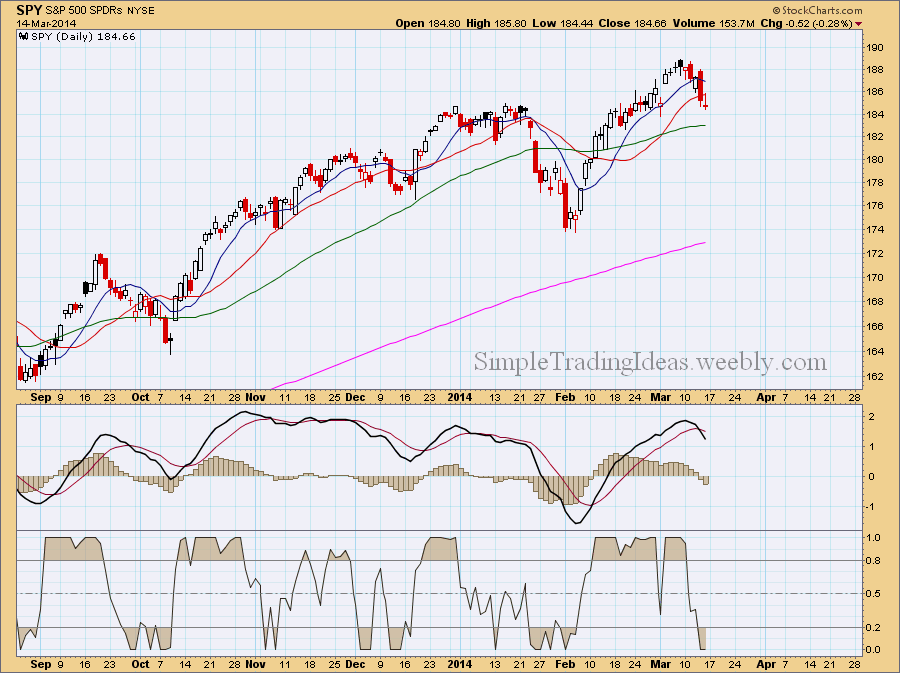
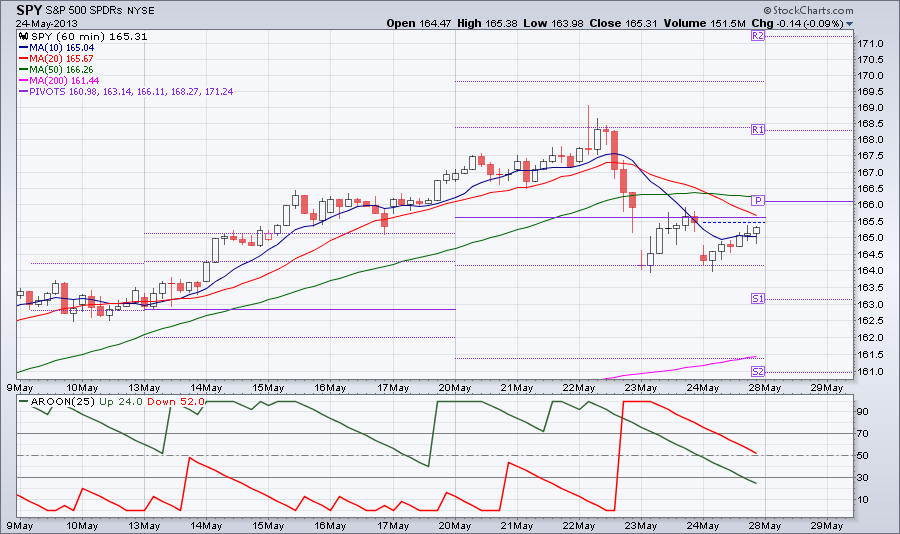
Tha daily chart below shows SPY, the S&P 500 ETF with the daily and weekly Aroon trend indicators in the indicator window. The shorter period Aroon represents the daily trend and the longer period the weekly trend. Currently Aroon Up is 100 for both of them.
0 Comments
The Chaikin Oscillator measures the momentum of the Accumulation Distribution Line. The calculation is similar to the calculation of MACD but instead of the price it uses the Accumulation Distribution Line. It is an indicator of an indicator. The Chaikin Oscillator is the difference of the 3-period EMA and the 10-period EMA of the Accumulation Distribution Line. Similar to other momentum indicators, it is designed to anticipate directional change in the trend as momentum change usually precedes trend change. The calculation uses both the price and volume since it is based on the Accumulation Distribution Line. The Chaikin Oscillator gives buy/sell signals by bullish/bearish divergences and centerline crossovers. The chart below shows the weekly chart for SPY, the S&P 500 ETF with the Chaikin Oscillator in the indicator window (the chart also shows the 20-period Price Channels). There was a noticeable bearish divergence since last year Novermber and the Chaikin Oscillator finally crossed below zero at the end of March. That is considered a sell signal according the Chaikin Oscillator. The Accumulation Distribution Line is falling and selling pressure dominates.
The Chandelier Exit can be used to set your trailing stop-loss during an uptrend or during a downtrend. You can read more about the Chandelier Exit here. Normally during an uptrend the Chandelier Exit is placed 3 ATR (Average True Range) below the 22-period high and during a downtrend it is placed 3 ATR above the 22-period low. The Chandelier Exit changes with new highs or lows and changes in volatility (ATR). It can prevent the trader from an early exit of a long or short position. During an uptrend a break below the Chandelier Exit can signal weakness or the end of an uptrend. The daily chart below shows SPY, the S&P 500 ETF with the Chandelier Exit. Currently it closed below the Chandelier Exit.
The hourly chart below shows SPY, the S&P 500 ETF with ATR (Average True Range) in the indicator window. ATR is a volatility indicator calculated from the True Range which uses absolute price changes. ATR is not a directional indicator it reflects the degree of interest or disinterest in a price move. Strong moves in either direction are often accompanied with large True Ranges. An increase in ATR can show strong buying or selling pressure. As you can see on the chart below Friday’s sharp decline took place with increased ATR on the hourly chart.
If you read my last couple of posts than you know that it wasn’t a surprise that the market moved lower during this week. This is of course not the end of the World but the way I see it the correction is not over yet. Next week we will possible see further decline. Corrections like this give a good opportunity to trade volatility, namely VIX. You can’t trade directly VIX but there are plenty of VIX derivatives available. The easiest thing is to buy VIX calls during a market decline. There were good entry points last week, now probably it would be too late. Good timing is almost always the most important part of a good trade. If you are in a VIX trade, don’t get too greedy, realistically set resistance levels. The daily chart below shows SPY with MACD and StochRSI indicators. Both indicators show a bearish bias. From the chart below it looks like the correction could take another week and a half. The Februaty low or the 200-day MA could be a support or maybe both.
Below you can see the weekly chart for SPY with the 14 period StochRSI below that. StochRSI failed to reach new highs and is turning lower.
The Accumulation Distribution Line is calculated from the current price and volume. It measures the cumulative flow of money into and out of the security, in this case the S&P 500 (SPY).
There are three steps to calculate ADL. First, calculate the Money Flow Multiplier which tells us the relationship of the current close to the high-low range. The Money Flow Multiplier fluctuates between +1 and -1. It’s positive when the close is in the upper half of the high-low range and negative when in the lower half. Second, multiply this by the volume which gives us the Money Flow Volume. Third, calculate a running total for the Money Flow Volume. Here are the 3 steps of the calculation: 1. Money Flow Multiplier = [(Close - Low) - (High - Close)] /(High - Low) 2. Money Flow Volume = Money Flow Multiplier x Volume for the Period 3. ADL = Previous ADL + Current Period's Money Flow Volume We can use ADL to confirm the price trend or look for bullish or bearish divergences. The chart below shows that both the price chart and ADL is moving down. This reinforces the current selling pressure. The indicator window also shows the 20-day SMA for ADL. ADL is currently below its 20-day SMA which is also bearish. As I noted yersterday SPY found short-term support and nicely advenced today. The chart below shows the daily chart for SPY today. There is certain weakness on the chart. One of them is that MACD is still below the signal line and the other one is that CCI and its 10 period MA are both below 0. If SPY continues to move up next week my upside target would be close to the upper Bollinger Band.
The chart below shows SPYwith the 64 period (which is about 3 months in trading days) Williams %R oscillator below the chart. When Williams %R is greater than -50, it's bullish. Currently the 64 period Williams %R is -29.11.
It looks like a bear flag bearish continuation pattern is forming on the 60 minute chart below. The chart is showing SPY with the Aroon indicator below the chart. The Aroon indicator is telling us if the stock is trending or not and how strong is the trend. The moving averages and the pivot points are helping us to determine the next support.
|
Loading
Search Site
Links
Archives
September 2014
Categories
All
|